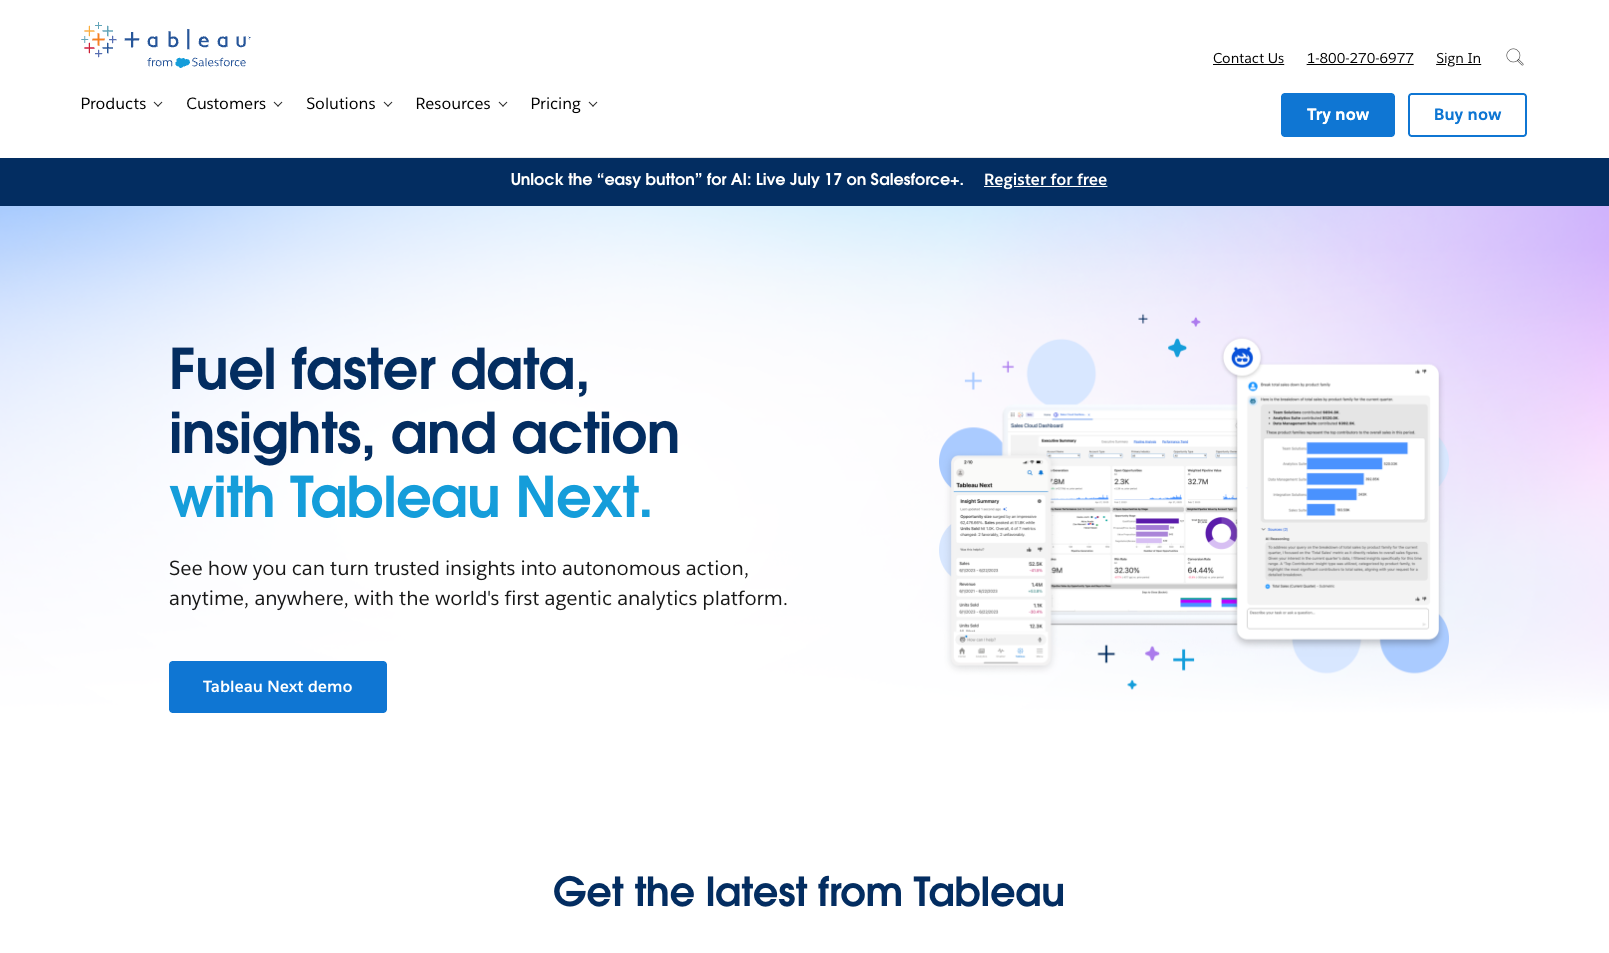
What is Tableau?
Tableau is a leading data visualization and business intelligence (BI) platform that enables users to analyze, visualize, and share data in an interactive, intuitive way. Known for its powerful yet user-friendly interface, Tableau transforms raw data into meaningful insights through dynamic dashboards and visual analytics, making it an essential tool for decision-makers across industries.
Key Features
- Interactive Dashboards: Tableau allows users to create interactive dashboards that present data visually through charts, graphs, maps, and other graphical formats. Users can drill down into specific metrics and customize views to explore data more deeply.
- Data Connectivity: Tableau connects to a wide range of data sources, including spreadsheets, databases, cloud services (like Google BigQuery, AWS, and Snowflake), and enterprise platforms such as Salesforce or SAP. This flexibility allows seamless integration of diverse data streams into a single view.
- Drag-and-Drop Interface: With its intuitive drag-and-drop functionality, Tableau lets users build complex visualizations without needing to write code. This makes it accessible to non-technical users while still offering advanced capabilities for data analysts and developers.
- Real-Time Analytics: Tableau supports real-time data analysis, enabling users to make faster, more informed decisions. Dashboards automatically update as data changes, providing a current view of business performance.
- Collaboration & Sharing: Users can easily share dashboards and visualizations with team members through Tableau Server, Tableau Online, or Tableau Public. This promotes collaboration and ensures stakeholders have access to up-to-date insights.
- Advanced Analytics: Tableau offers built-in statistical tools and supports integration with R, Python, and predictive models, empowering users to perform complex data analyses and forecasting.
Who Uses Tableau?
Tableau is used by data analysts, business intelligence professionals, executives, marketers, and anyone who needs to make data-driven decisions. It serves organizations of all sizes across sectors such as finance, healthcare, retail, education, and government.
Benefits
Tableau simplifies data analysis by turning large volumes of information into clear, actionable insights. It enhances business agility, supports informed decision-making, and encourages a data-driven culture within organizations.
Conclusion
Tableau is a powerful BI tool that democratizes data access and empowers users at all skill levels to visualize, explore, and understand their data, driving smarter strategies and better business outcomes.